Overview
1 Create Pulse IoT Sensor (Thing) Template
2 Whitelist IoT Sensor Template
3 Onboard Sensor(s) as a Gateway Connected Thing
4 Retrieve files via Github & configure Linux Environment Monitor Service
5 Inspect Environment Monitor Metrics in Pulse Console
This guide will show you the steps necessary to enable Environment Monitoring (Temperature, Humidity and Barometric Pressure) with Pulse IoT Center v2.0 managed Gateways utilizing a Bash Script on the Gateway. All of the steps indicated below could be automated and pushed to Gateways via Pulse Campaign Scripts; however, for the purposes of better understanding the process, manual steps are indicated below.
Pre-Requisites
- Dell 3003 IoT Gateway with Ubuntu Installed
- Dell 3003 IoT Gateway with Pulse Agent installed and Enrolled in Pulse Console
Create Pulse IoT Sensor (Thing) Template
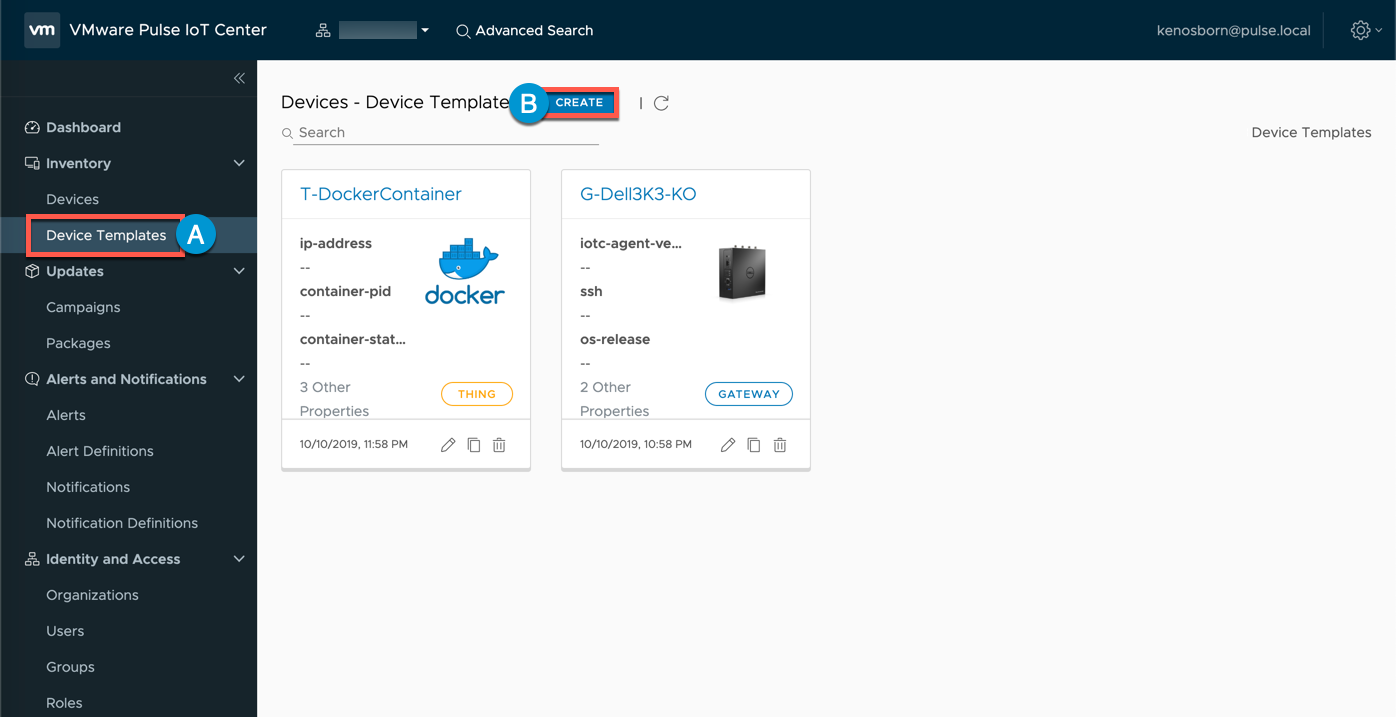
1A Select Device Templates
1B Click CREATE
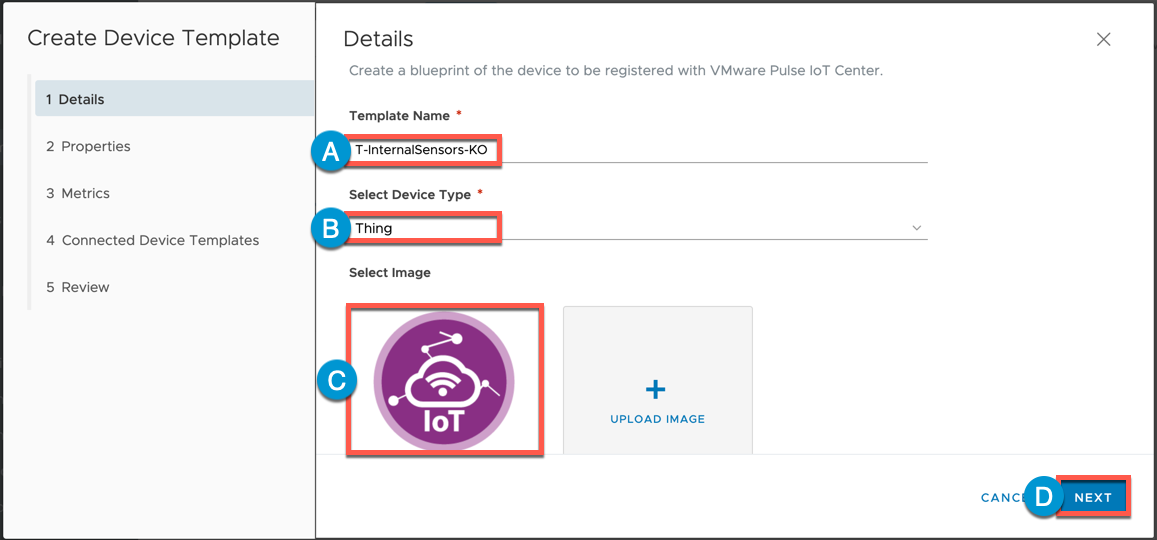
2A Enter Template Name
2B Device Type: Thing
2C (Optional) Upload Image
2D Click NEXT
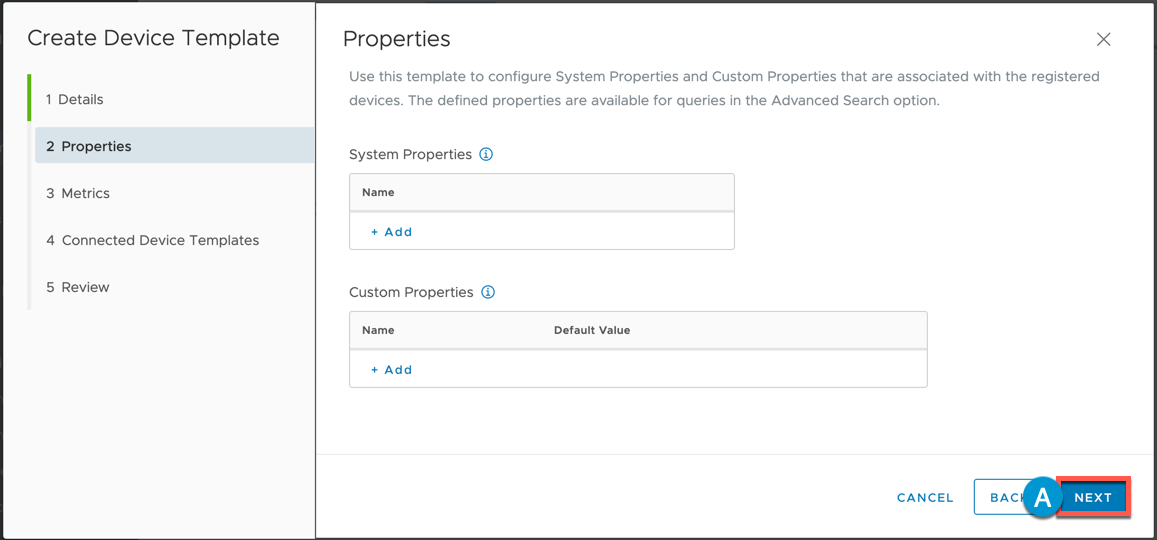
3A Click NEXT
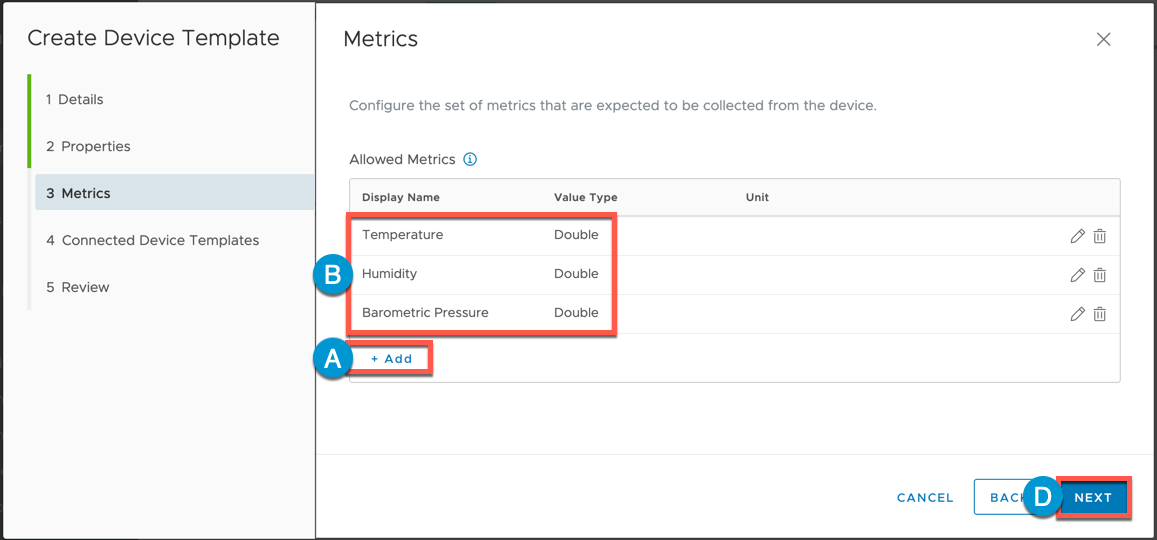
4A For each new Metric, click +ADD
4B Create the following Metrics:
Display Name: Temperature | Value Type: Double
Display Name: Humidity | Value Type: Double
Display Name: Barometric Pressure | Value Type: Double
4C Click DONE (not shown)
4D Click NEXT
5A Click NEXT
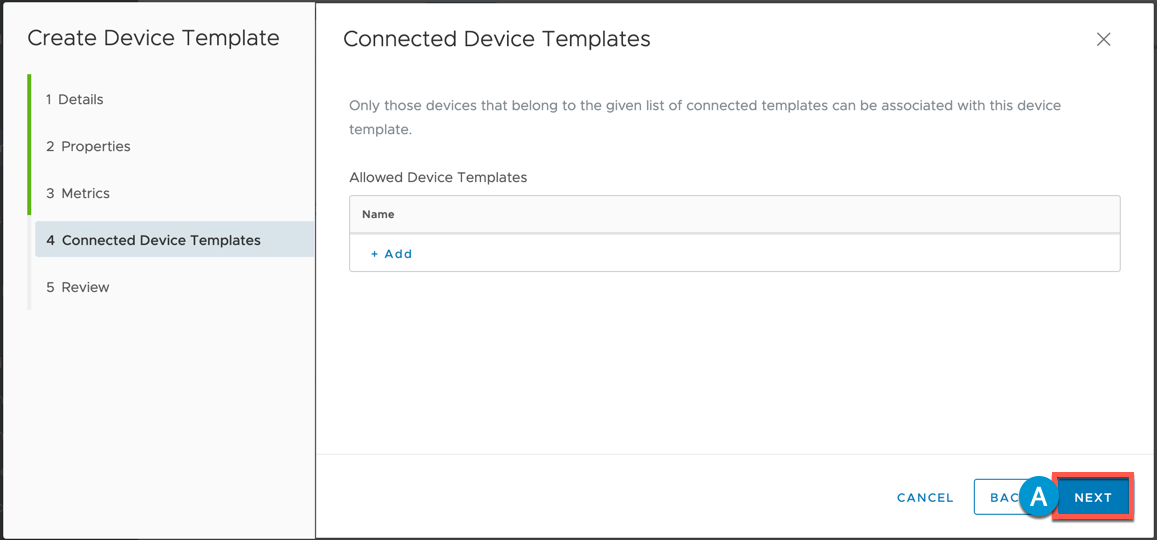
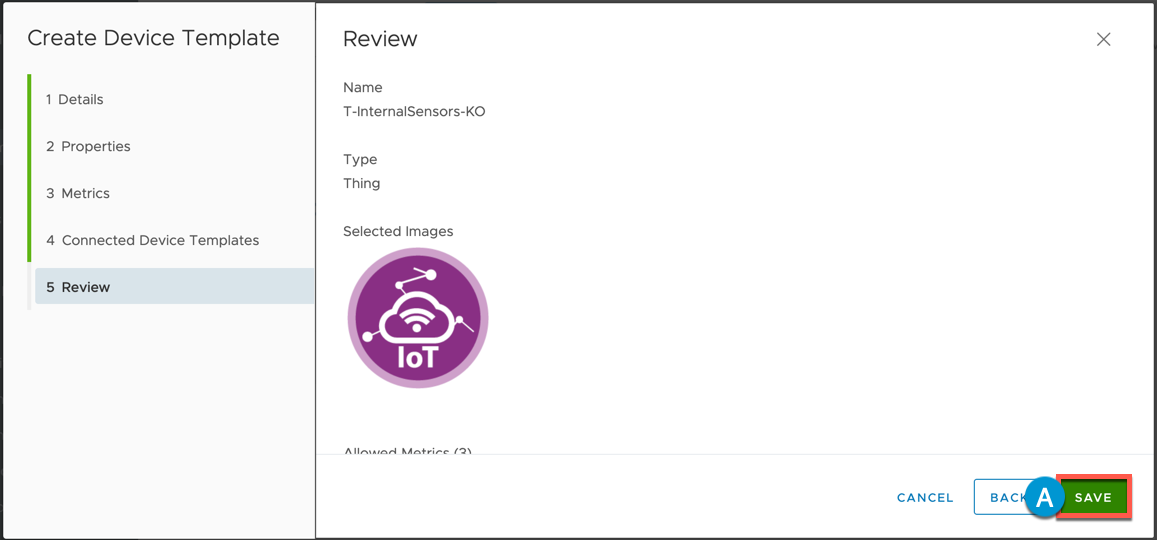
6A Click SAVE
Whitelist (allow) IoT Sensor Template
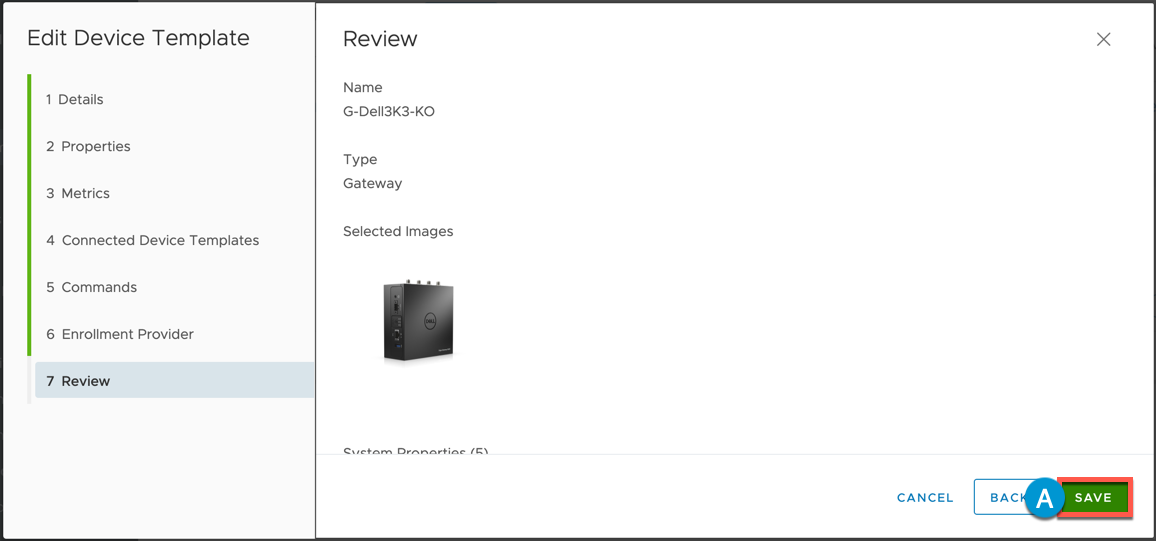
In this step, we will edit the Gateway Template of your choice in order to allow/whitelist our newly created IoT Sensor Thing Template. If this step is not performed, then you will not be allowed to Onboard the InternalSensors as a Gateway Connected Thing.
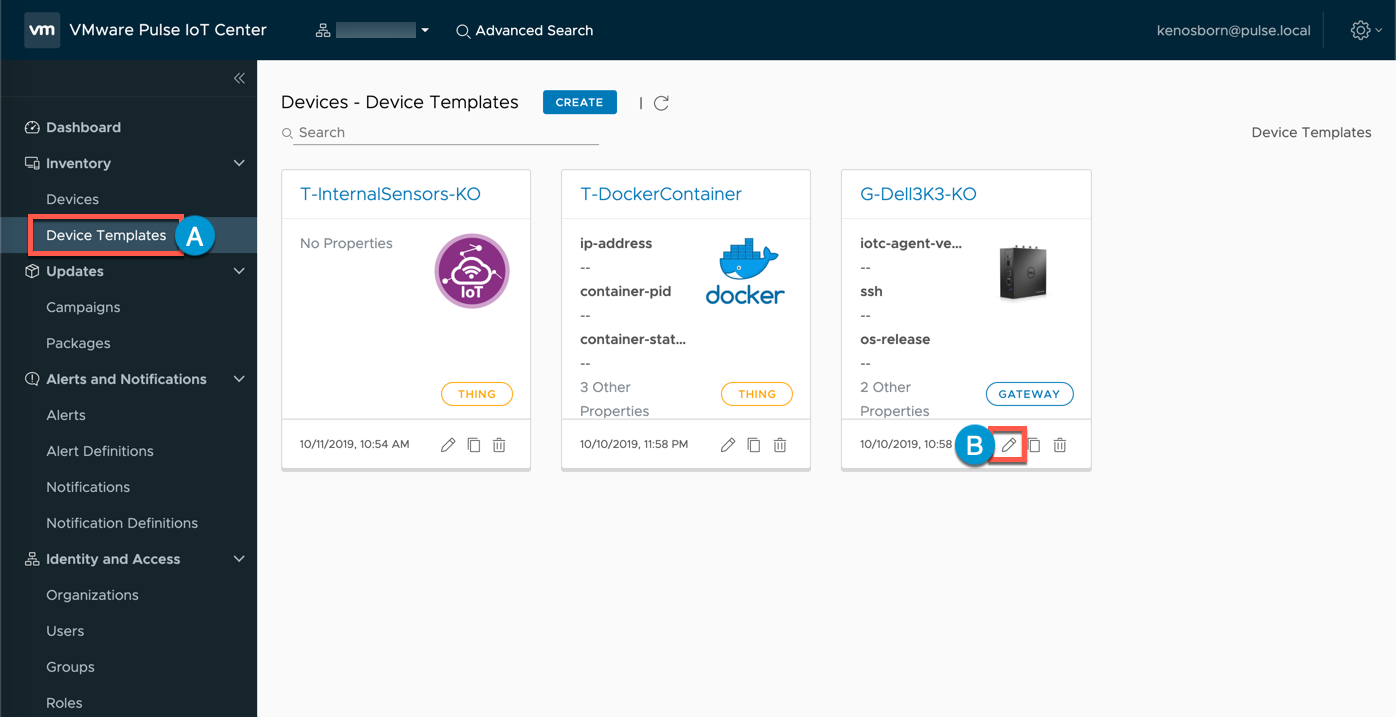
1A Select Device Templates
1B Edit the Gateway Device Template by Clicking the Pencil Icon
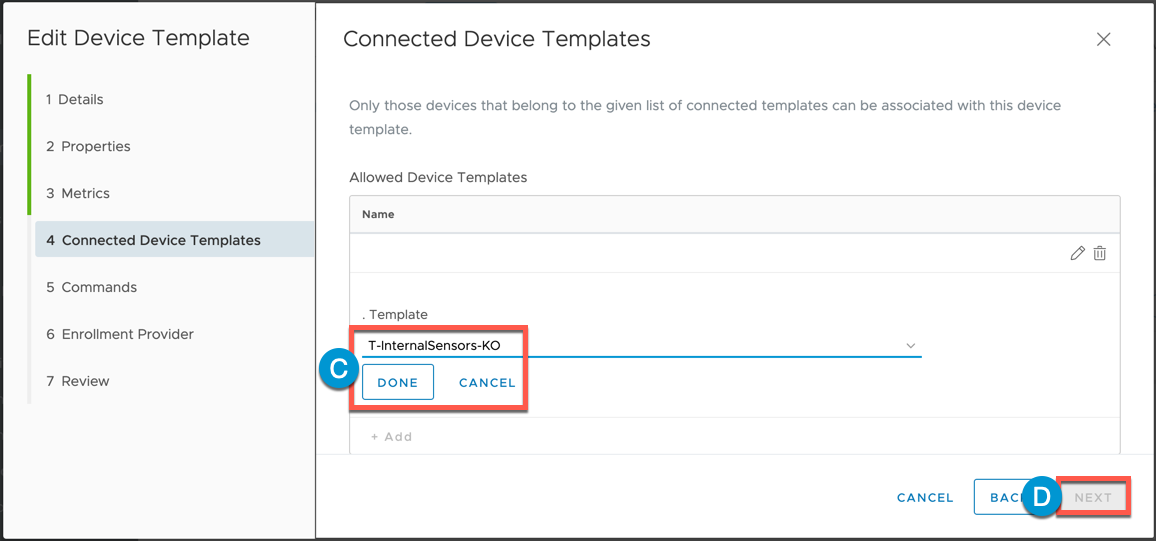
2A Click NEXT until you are on the Connected Device Templates Step (Not Shown)
2B Select +Add (Not Shown)
2C Select the T-InternalSensors-KO template that you created previously and click DONE
2D Click NEXT until you reach the last step of the Wizard
3A Click NEXT until you reach the last step of the Wizard then select SAVE
Onboard Sensor(s) as a Gateway Connected Thing
1 SSH to Gateway and su up
ssh admin@[ip address]
sudo su

2 cd to Pulse Agent bin directory

3A Retrieve Gateway Device ID (this can be done via Pulse Console, Devices\Gateway\Basic Properties tab or by using the ./DefaultClient get-devices command)
3B Copy the Device ID elsewhere (e.g. notepad) for future reference
./DefaultClient get-devices

4A Onboard the InternalSensors as Gateway Connected Thing by issuing the following command
/opt/vmware/iotc-agent/bin# ./DefaultClient enroll-device --template=T-InternalSensors-KO --name=InternalSensors-[Name of your Gateway] --parent-id=[copy Gateway Device ID from notepad]Device Id: bb999fe0-5397-4e47-9bfe-b0ef626ce8a0Parent Device Id: d0c0192f-b29e-4ae1-a806-38289ea591d5Status of enroll device response: 0

5A Return to the Pulse Console and select Devices
5B Click your Gateway

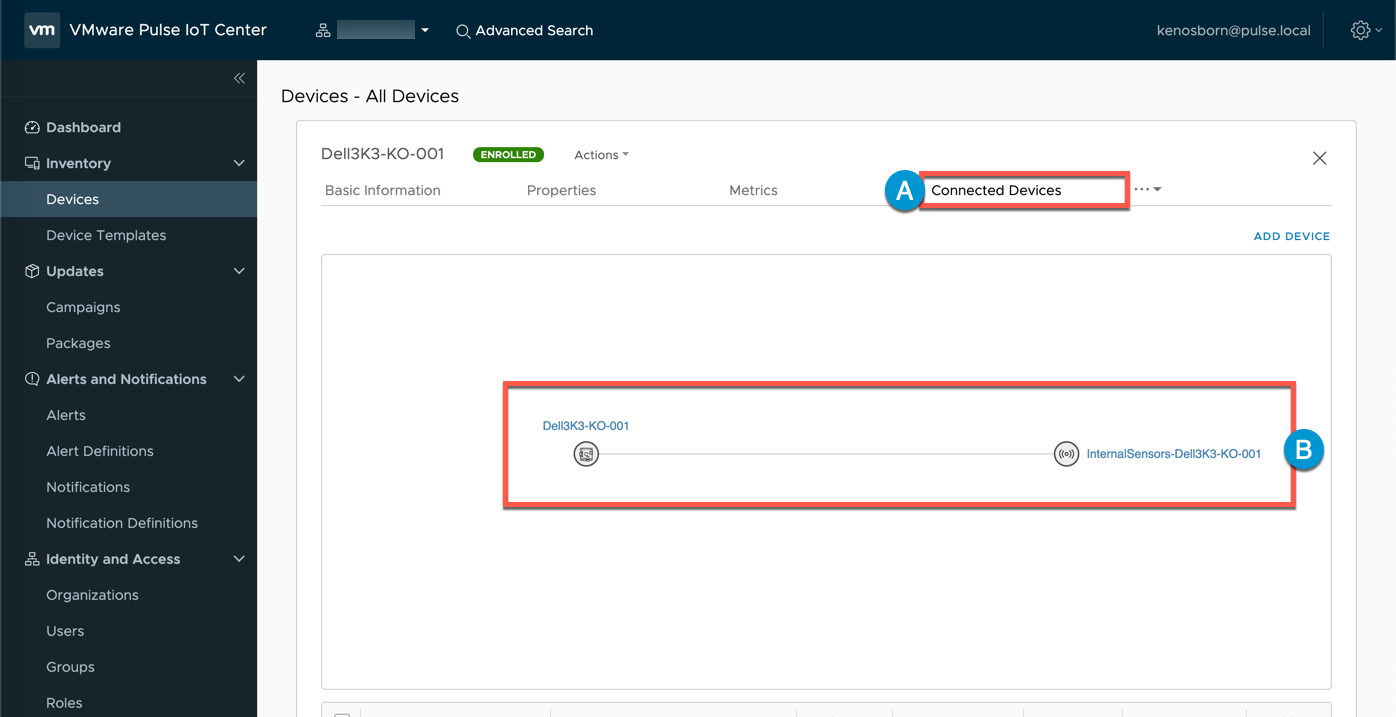
6A Select Connected Devices
6B Verify that your newly onboarded InternalSensors Thing is connected up to your Gateway
Retrieve files via Github & configure Linux Environment Monitor Service
1 Return to your Gateway SSH session and issue the following commands (note: Git must be installed and github.com accessible via the Gateway. Alternatively, you can download the files via a web browser (link) elsewhere and transport to the Gateway however you choose, e.g. WinSCP, SCP, etc.)
cd /tmp

2 Next we will create a new directory within /opt, copy our envmonitor.sh script and dg-query to this location and then make both files executable
mkdir /opt/envmonitor
cp envmonitor.sh /opt/envmonitor
chmod +x /opt/envmonitor/envmonitor.sh
cp dg-query /opt/envmonitor
chmod +x /opt/envmonitor/dg-query

3 Let’s copy our Linux Service descriptor file to the proper location, reload Services and set this new Service to start at boot.
cp envmonitor.service /etc/systemd/system
chmod 644 /etc/systemd/system/envmonitor.service
systemctl daemon-reload
systemctl enable envmonitor.service

4 Issue the following command to check that the service is in place (we do not expect the service to be running yet - we’ll start it in a moment - so the ‘inactive (dead)’ response is expected at this time
service envmonitor status

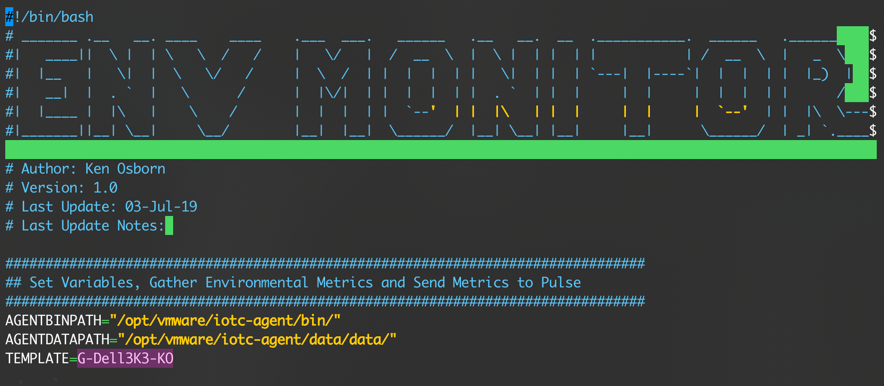
5 Validate the the ‘TEMPLATE’ variable name in the envmonitor.sh script matches your Gateway Template Name
cd /opt/envmonitor
nano envmonitor.sh
6 Let’s confirm that the script is working prior to starting the service
./envmonitor.sh

6 Note that are Metrics are being sent as indicated (every 15 seconds). Press CTRL-C to break out of script.
7 Start the envmonitor service then check it’s status
service envmonitor start
service envmonitor status

(CTRL-C to exit status view)
Inspect Environment Monitor Metrics in Pulse Console
1A Return to the Pulse Console and Select Devices
1B Click your Gateway

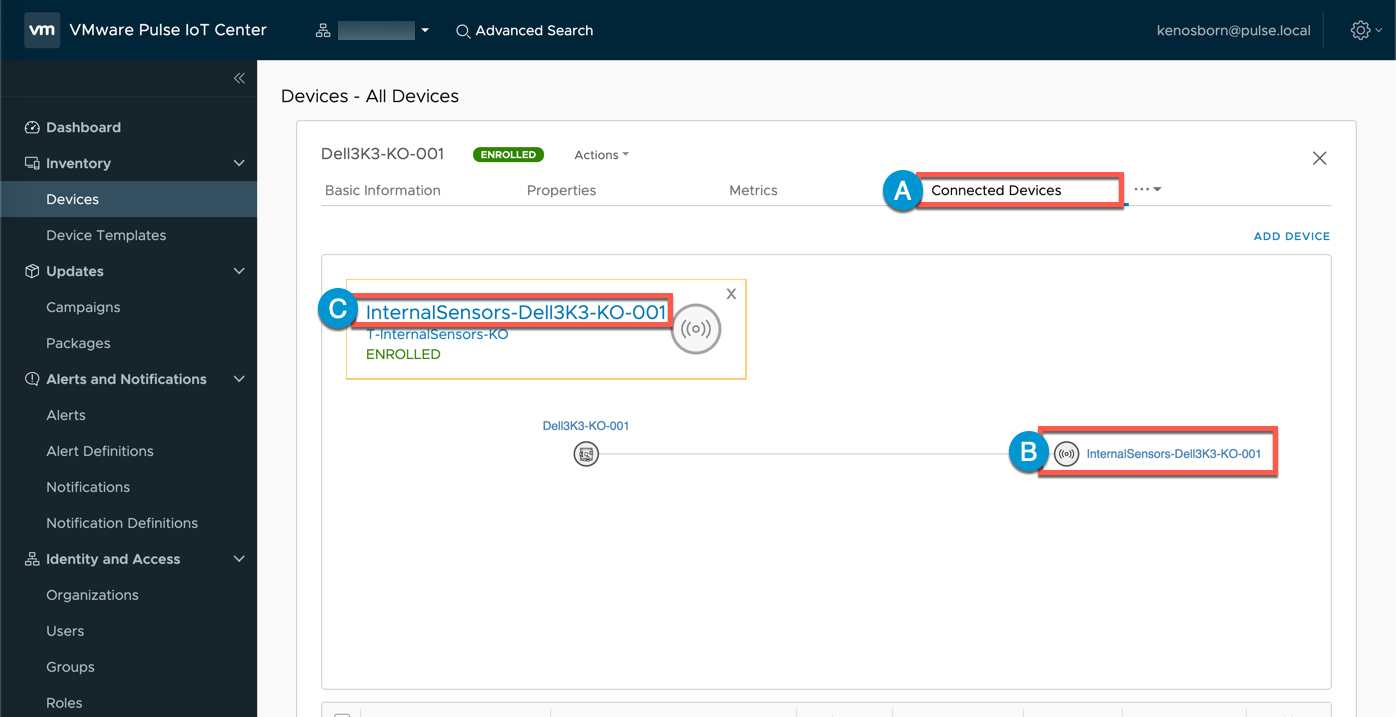
2A Select Connected Devices
2B Click InternalSensors Thing
2C Click InternalSensors in Panel
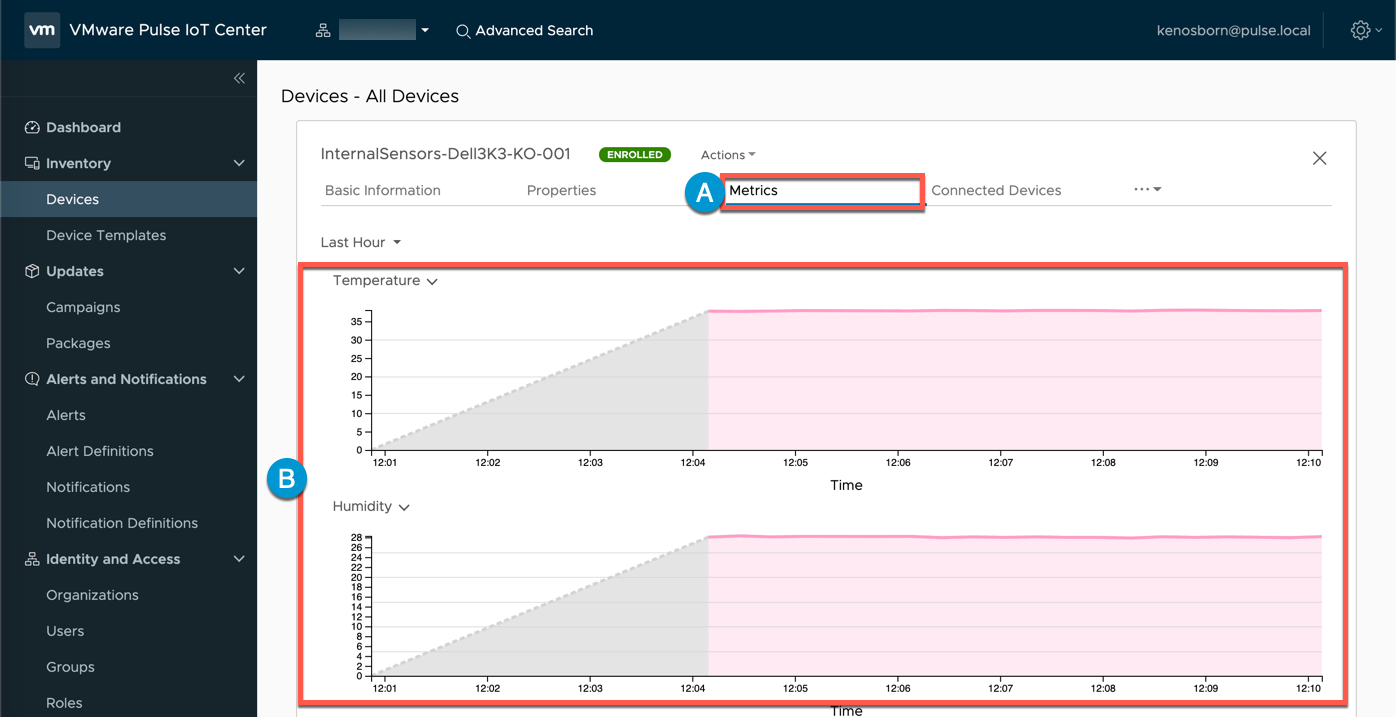
3A Click Metrics
3B Expand Metrics and observe Values
NOTE: It can take ~5 minutes for these Metrics to start populating - thank you for your patience
Thank you - this concludes our Dell 3003 IoT Gateway Environment Monitoring Lesson.
comments powered by Disqus